AI solutions · Document AI
Chart understanding, infographic question answering and chart-to-code
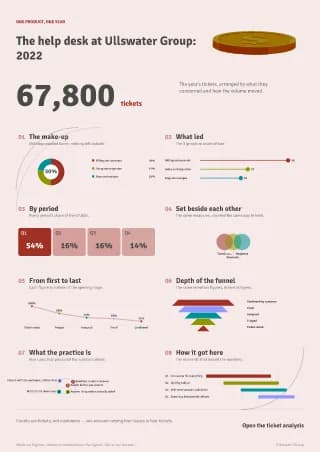
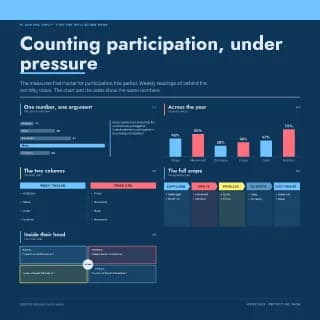
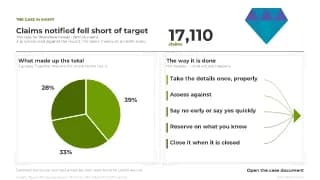
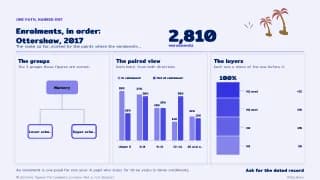
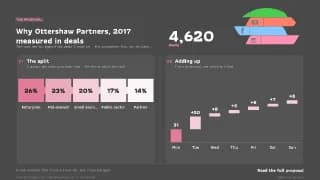
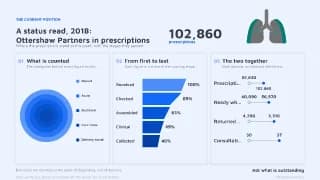
Each infographic exposes its chart families in slot order and, where recoverable, the data table the charts were drawn from. Text is live, so no OCR step is needed to build supervision.
Fields that carry the supervision
chart_families[]data_tabletexts[]headlinesubjectsector
A training recipe
Generate chart-QA pairs from data_table and texts[] without annotation cost. Fine-tune a vision-language model on png_448 with the generated answers.
Evaluation
Buyers typically run DINO, SSIM, LPIPS and PSNR for image-to-SVG; FID, CLIP text-image score and render-validity rate for text-to-SVG; alignment and overlap metrics for layout; and IoU over room polygons for floor plans. A held-out evaluation set stratified by complexity is specified in the order, so these numbers stay comparable between runs.
Datasets for this task
Infographics
Infographic Dataset
1,800,000 SVG assets
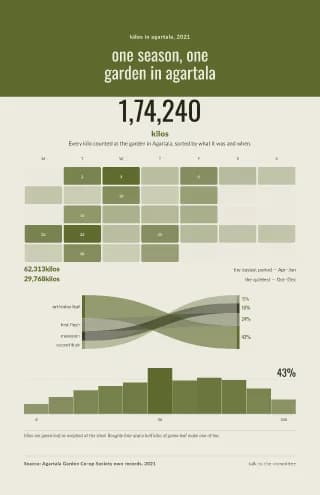
Single-page infographics with live text, chart geometry and a 33-field record per asset.
- Live text
- Vector geometry
- Chart families in slot order
- Palette and font IDs
Presentations
Presentation Slide Dataset
500,000 SVG assets
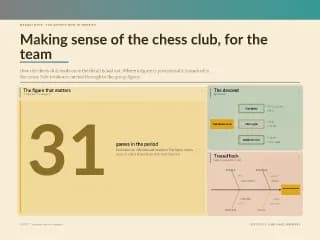
Half a million 16:9 slides built from PowerPoint template families, every chart and headline live, each page leading with its own conclusion.
- Live text
- Chart families in slot order
- Deck template family
- Grid and palette IDs